Yesterday, when Coinbase faced outage, the stock price level dropped from $205 to $195, causing a downfall of approximately 5%.
Coinbase has found itself at the center of multiple controversies lately. A massive $1 billion Bitcoin withdrawal, a significant outage affecting users, and a glitch erasing $100 billion in Bitcoin wealth.
The Billion-Dollar Exodus

Photo: Santiment
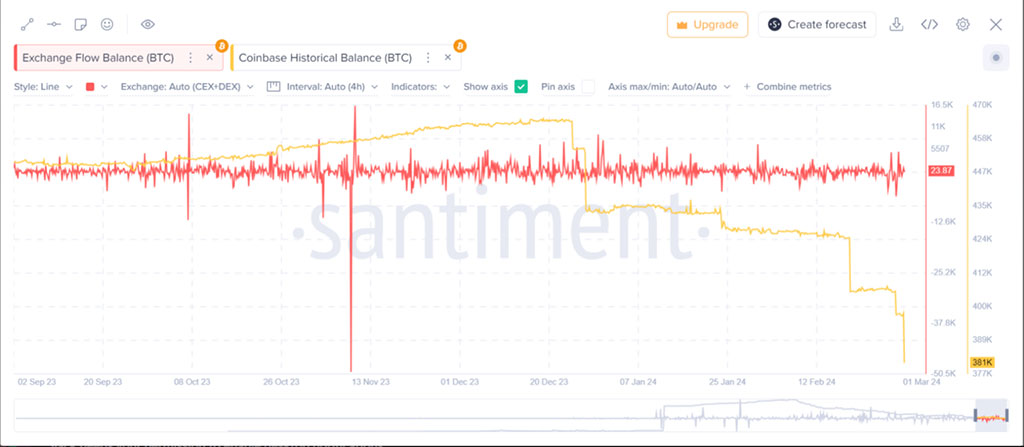
Recently, Coinbase experienced a massive outflow of Bitcoin, with approximately 16,000 BTC, valued at roughly $1 billion, being withdrawn in a single transaction. This event marked one of the most significant withdrawals the platform has ever witnessed. Confirmations from various analytics platforms, including Santiment, Arkham Intelligence, and Coinglass, validated the massive drop in Coinbase’s Bitcoin holdings.

This withdrawal occurred amidst a Bitcoin bull run, with the cryptocurrency’s value soaring well above $60,000, indicating a possible shift in investor sentiment or a strategic move by a significant player in the market.
Outage amidst a Surge
Compounding the drama, Coinbase suffered a significant outage that left some users unable to access their accounts, witnessing zero balances, and facing issues with buying or selling. The outage, attributed to an unprecedented surge in traffic as Bitcoin climbed above the $63,000 mark, highlighted the platform’s vulnerabilities. Brian Armstrong, Coinbase’s co-founder and CEO, admitted the platform was tested beyond its limits, with traffic surges exceeding ten times the expected volume.

Photo: Brian Armstrong / X
The $100 Billion Glitch

Photo: TradingView
Adding to the turmoil, a glitch on Coinbase wiped out an estimated $100 billion in Bitcoin wealth in under 60 minutes. The glitch led to a panic among traders as they saw their balances drop to zero, causing Bitcoin’s value to plummet from $64,300 to $59,461. Although Coinbase assured its users that their assets were safe and the account balance display issues had been restored, the rapid loss in market cap and the temporary prevention of Bitcoin from breaking its 2021 all-time high left a lasting impact on investor confidence.
Impact on Coinbase (COIN) Stock

Photo: TradingView
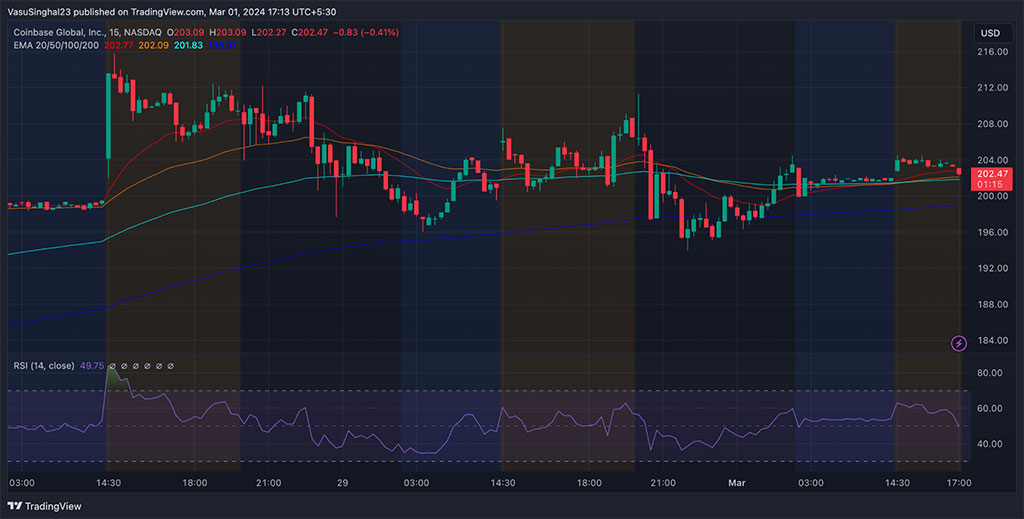
This chart depicts the 15-minute price action for Coinbase Global Inc (NASDAQ: COIN) on March 1st, with data points at the close of each 15-minute interval. The chart includes four Exponential Moving Averages (EMAs) with periods of 20 (red line), 50 (orange line), 100 (blue line), and 200 (brown line). These EMAs serve as indicators of short-, medium-, and long-term trends and potential support or resistance levels.
Yesterday, when the exchange faced outage, the stock price level dropped from $205 to $195, causing a downfall of approximately 5%. At the time of the last data point, 08:45 UTC+5:30, the stock was trading at $202.71, slightly down by 0.29%. The stock opened the session above the 200 EMA, indicating a bullish signal. However, throughout the trading period, the stock price oscillated around the EMAs, suggesting a lack of clear directional momentum, as reflected by the crossover of the 20 and 50 EMAs.
The Relative Strength Index (RSI), which measures the magnitude of recent price changes to evaluate overbought or oversold conditions, is at 51.46. This value is close to the mid-line of 50, suggesting that the stock is neither overbought nor oversold in the concise term.
The overall trading pattern shows some volatility with multiple crosses over the EMA lines. Still, the proximity of the stock price to the EMAs suggests a consolidating market. The RSI is near 50 reinforces this view, indicating that traders might be awaiting further signals before committing to a clear bullish, or bearish stance.
